Cartographic Representation
Shoreline data can be used to display shoreline boundaries, classifications, and associated features.
It is important when choosing the appropriate shoreline to consider the scale of the shoreline in relation to the scale of the map.
Shoreline Scale Comparison
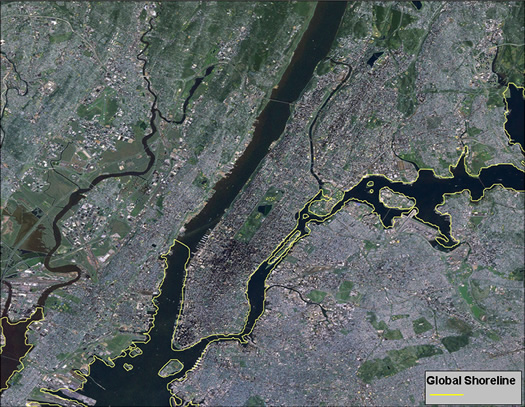
Global scale shoreline (low resolution)
The scale of the global shoreline depicted in this graphic is approximately 1:250,000 or greater. The scale of the imagery is approximately 1:130,000. Notice the crudeness of the shoreline detail compared to the image.
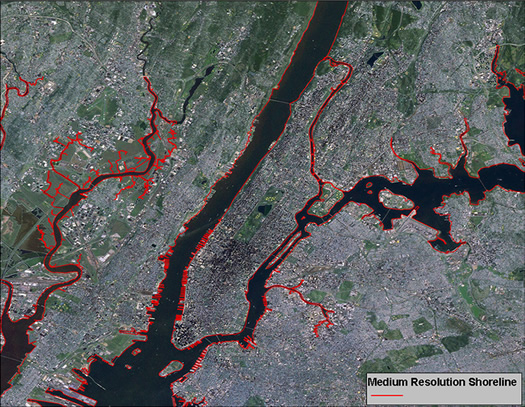
National scale shoreline (medium resolution)
The scale of NOAA's medium-resolution shoreline depicted in this graphic is approximately 1:70,000. The imagery is approximately 1:130,000. Notice the detail of the shoreline is more appropriate than the global shoreline for representing features on the image.
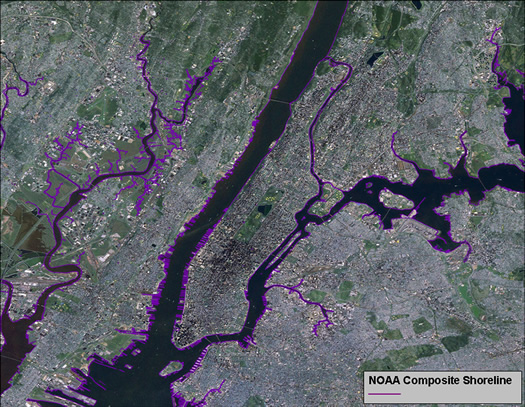
Local scale shoreline (high resolution)
The scale of NOAA's composite shoreline depicted in this graphic can range from 1:5,000 to 1:20,000. The imagery is approximately 1:130,000. The detail of the shoreline closely matches features on the image.
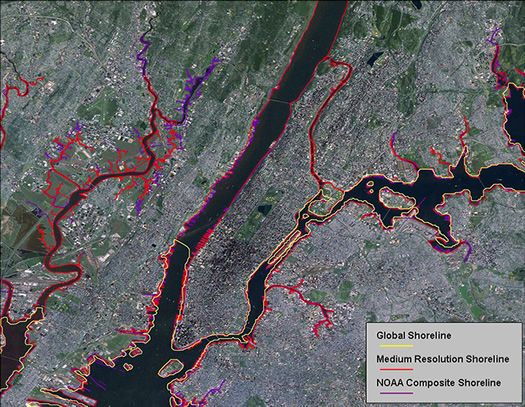
Comparison of scale
This graphic depicts three shorelines (global, national, and local scale) on an image at a scale of approximately 1:130,000. At this image scale, the local scale shoreline (NOAA composite shoreline) most accurately depicts the features in the image.
Cartographic Shoreline Classifications
Environmental Sensitivity Index (ESI) maps classify Shorelines based on their physical and biological character, then use color-coding to indicate their sensitivity to oiling.