NOAA Shoreline Website

A Guide to National Shoreline Data and Terms

Shoreline Change Analysis

Changes in shoreline through processes of accretion and erosion can be analyzed in a geographic information system (GIS) by measuring differences in past and present shoreline locations. Several resources are available for both extracting shoreline positions and quantifying shoreline change.


Lidar Shoreline Extraction

Screenshot

This image shows high-resolution lidar data with an extracted shoreline in blue. As opposed to aerial photography, where a shoreline would be derived based on visual identity of a feature (such as the wet/dry line), lidar data provides the advantage of deriving a true datum-based shoreline (such as the mean high water line or specific elevation contours).


Calculating Shoreline Change

Screenshot

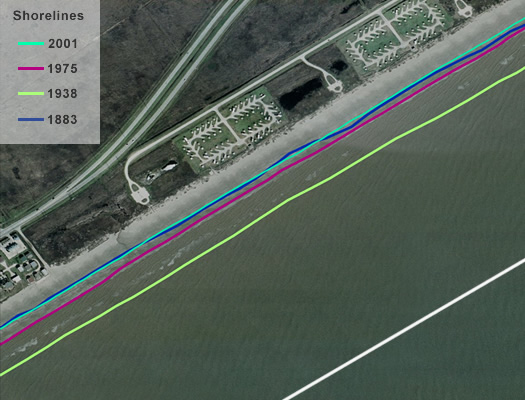
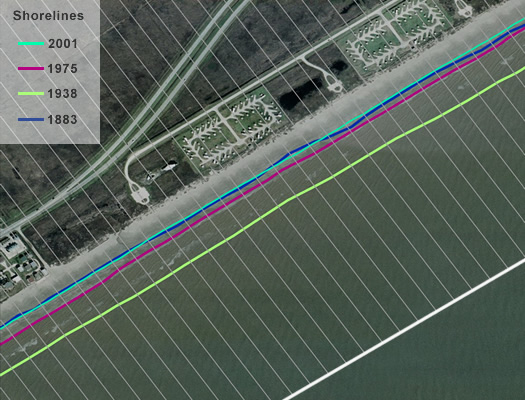
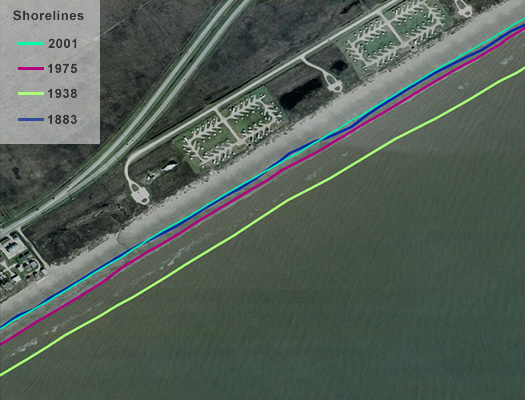
Add historical and modern vector shorelines

Historic and modern shorelines can be used as a basis for determining shoreline change rates. It is helpful when determining long-term shoreline change to have sequential historic shorelines dating as far back as 100 yrs to the most recent available shoreline.

Screenshot

Draw a baseline

The baseline is an arbitrary line that can be drawn either shoreward or landward of shorelines to serve as the origination point of transects used for calculations.

Screenshot

Cast transects

Transects are cast either manually or using an automated system (ie. DSAS). Automated systems have the ability to cast transects quickly over large areas.

Screenshot

Calculate the rate of change

The rate of change can be determined by measuring the distance between the shoreline/transect intersection points. Linear regressions are common statistical analyses for determining shoreline change rates.