Nautical Chart Production
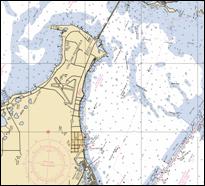
Example of a nautical chart section.
A nautical chart depicts the nature and shape of the coast, water depths, general topography of the ocean floor, locations of navigational dangers, the rise and fall of tides, and locations of human-made aids to navigation.
Nautical charts were originally created from NOAA topographic surveys (T-sheets) and NOAA hydrographic surveys. Topographic surveys mapped the land, including the shoreline, natural and cultural features, and elevations above the sea. Hydrographic surveys mapped the depths of coastal waters and offshore hazards. These sources have recently been converted to digital raster format and serve as base data for electronic navigational charts (ENC) produced by the Office of Coast Survey. High-resolution shoreline data are incorporated as new photogrammetric surveys are conducted. Similarly, new hydrographic surveys will gradually supersede depths that originated from old surveys on the paper chart.